Factory Analytics brings transparency to every session
By Factory Team - October 2, 2026 - 2 minute read
Product
Share
By Factory Team - October 2, 2026 - 2 minute read
Product
Share
Factory is the only autonomous software engineering platform that provides engineering leaders with full transparency into consumption, model efficiency, and adoption, broken down by model and by user across every session in the organization.
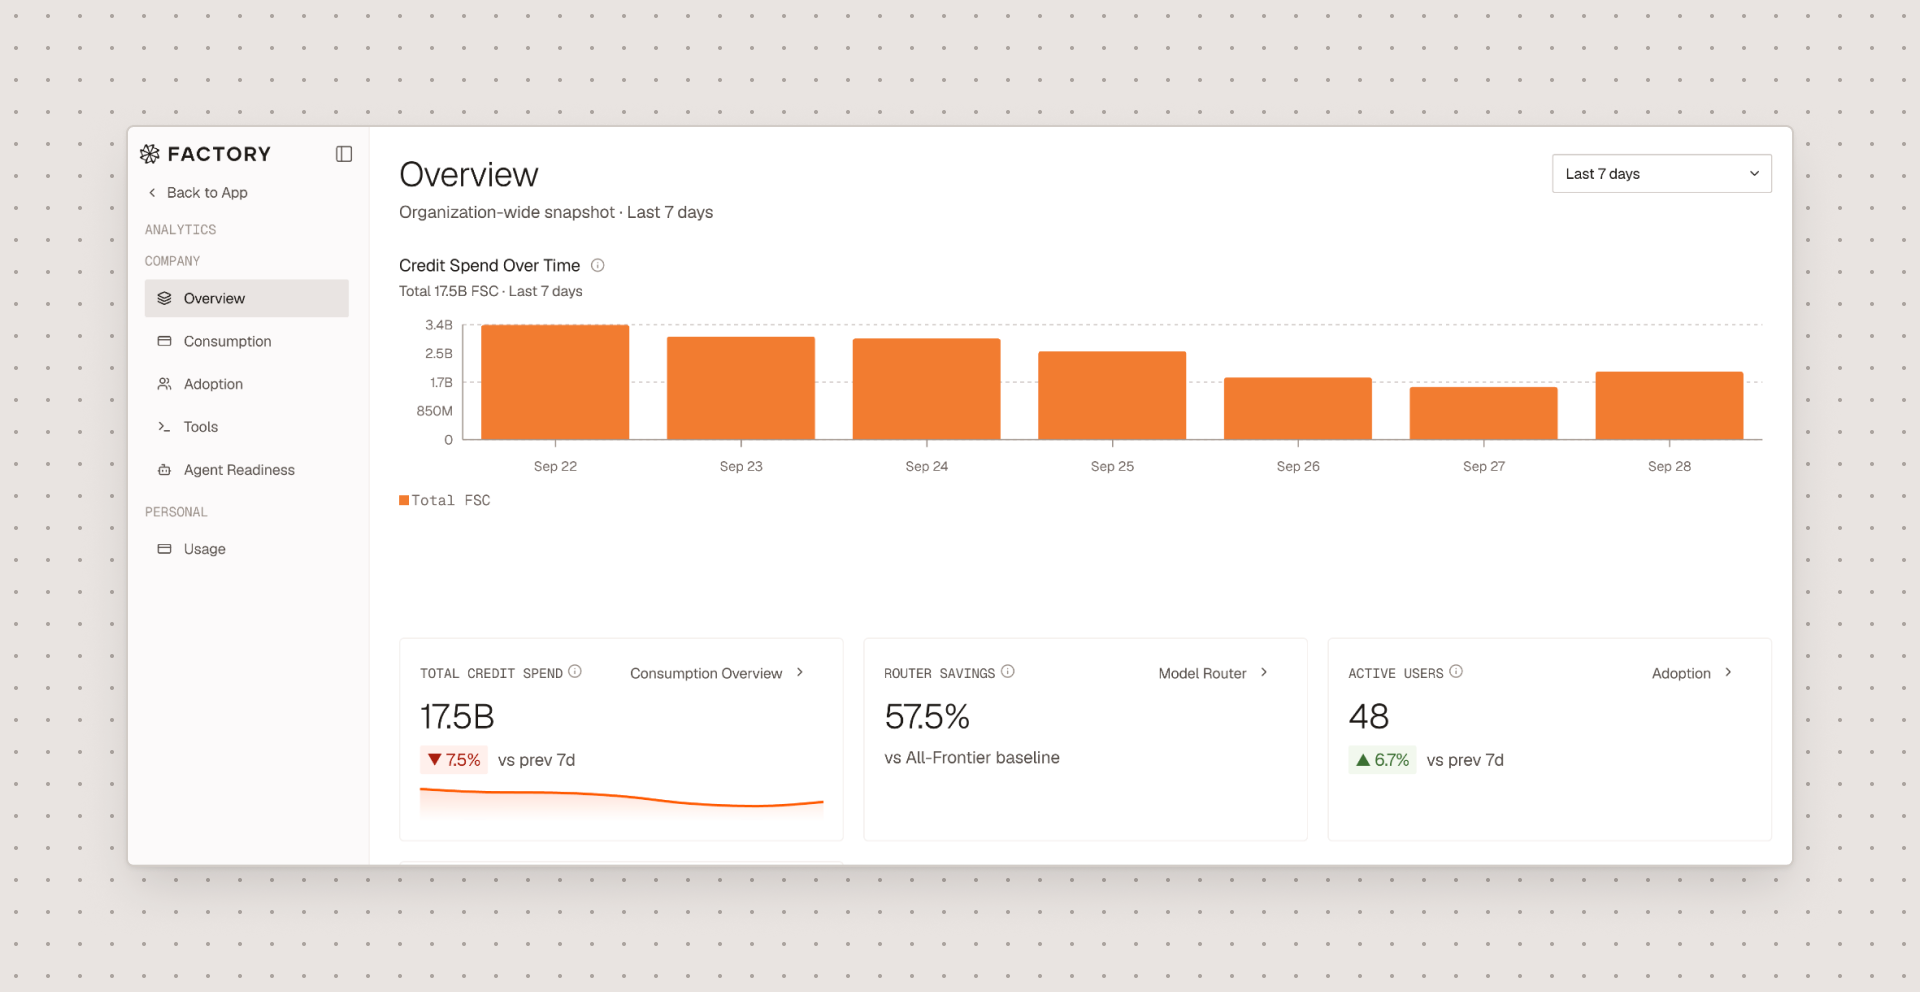
Agentic software engineering is a growing line item for engineering leaders and CFOs. Platforms earn continued trust by showing where that spend goes and keeping it in check, without making engineers manage their own usage. The redesigned Analytics in Factory, available today, gives engineering leaders that visibility in one place.
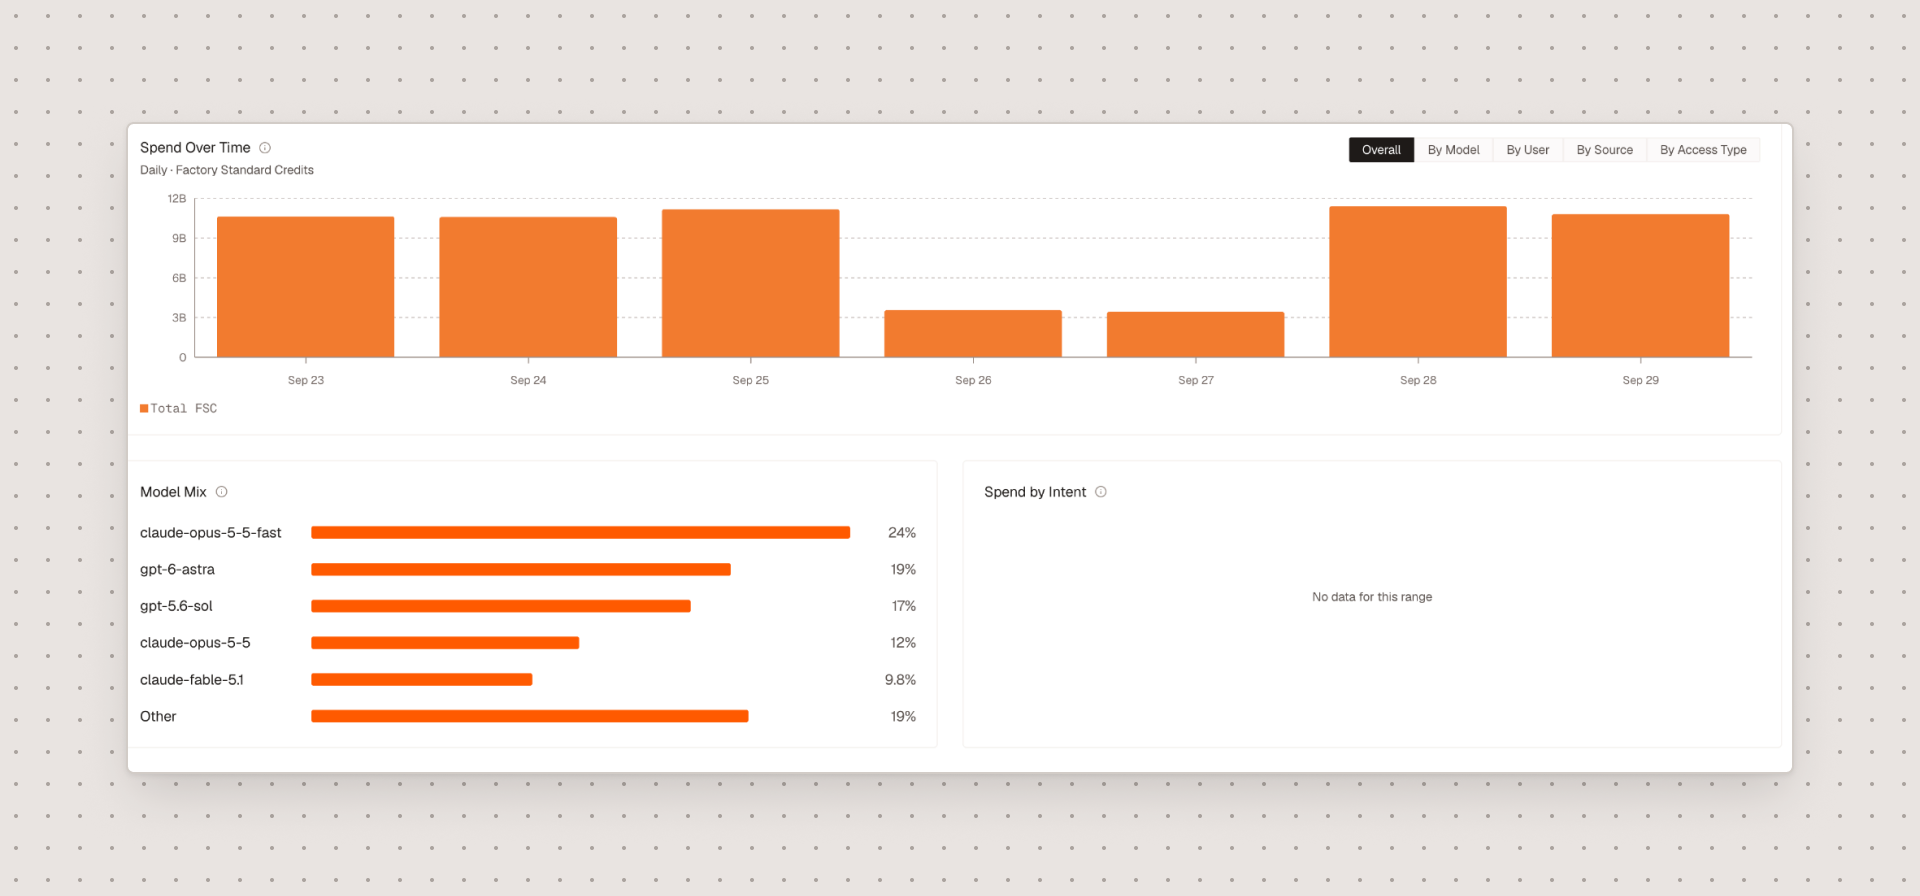
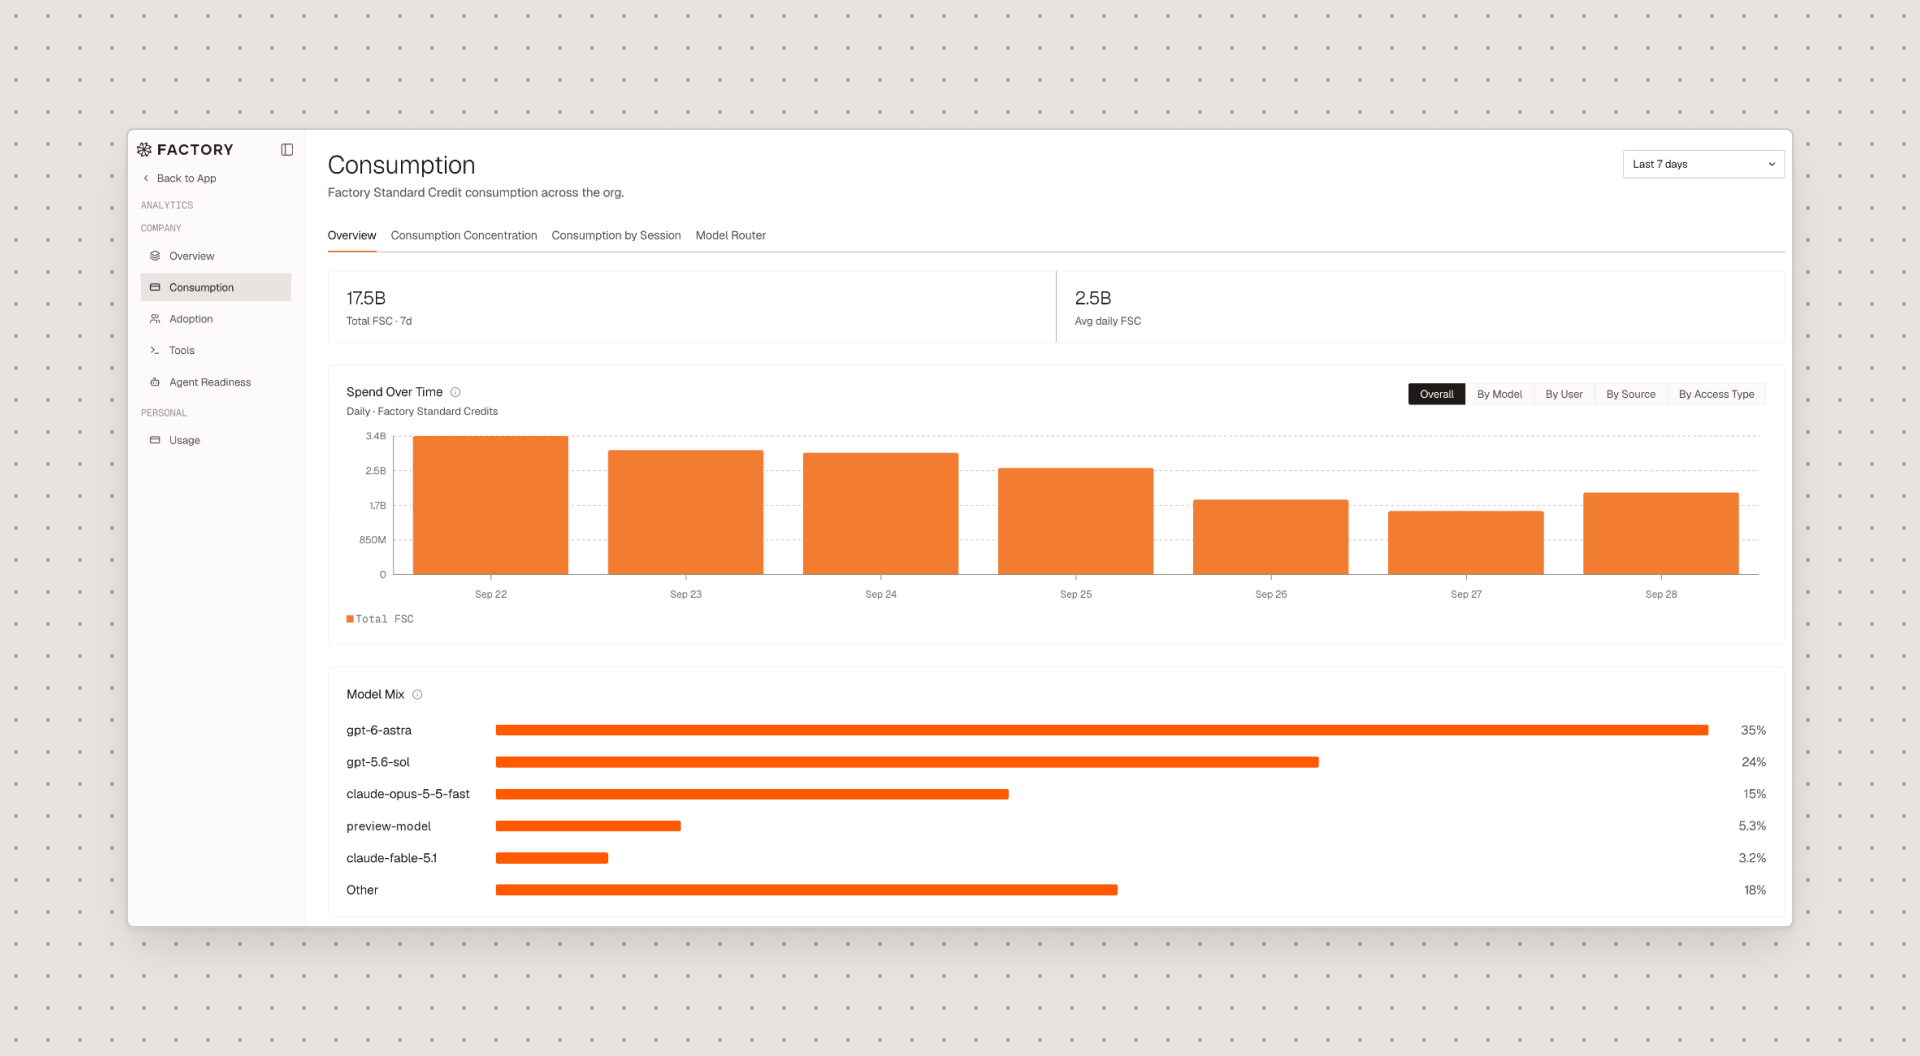
The Consumption view reports credits over time, by model, and by user. Factory reports consumption at the level where decisions get made: which model ran and who ran it. The Usage Over Time chart separates total consumption from the per-model split, and the Model Mix chart shows each model's share. When consumption spikes, teams can identify the cause directly instead of asking the account team for a report.
The Cost Concentration chart plots cumulative consumption across the organization. In most Factory deployments, a smaller group of power users and automations accounts for the majority of consumption. Engineering leaders can confirm that concentration maps to the teams and workloads they expect.
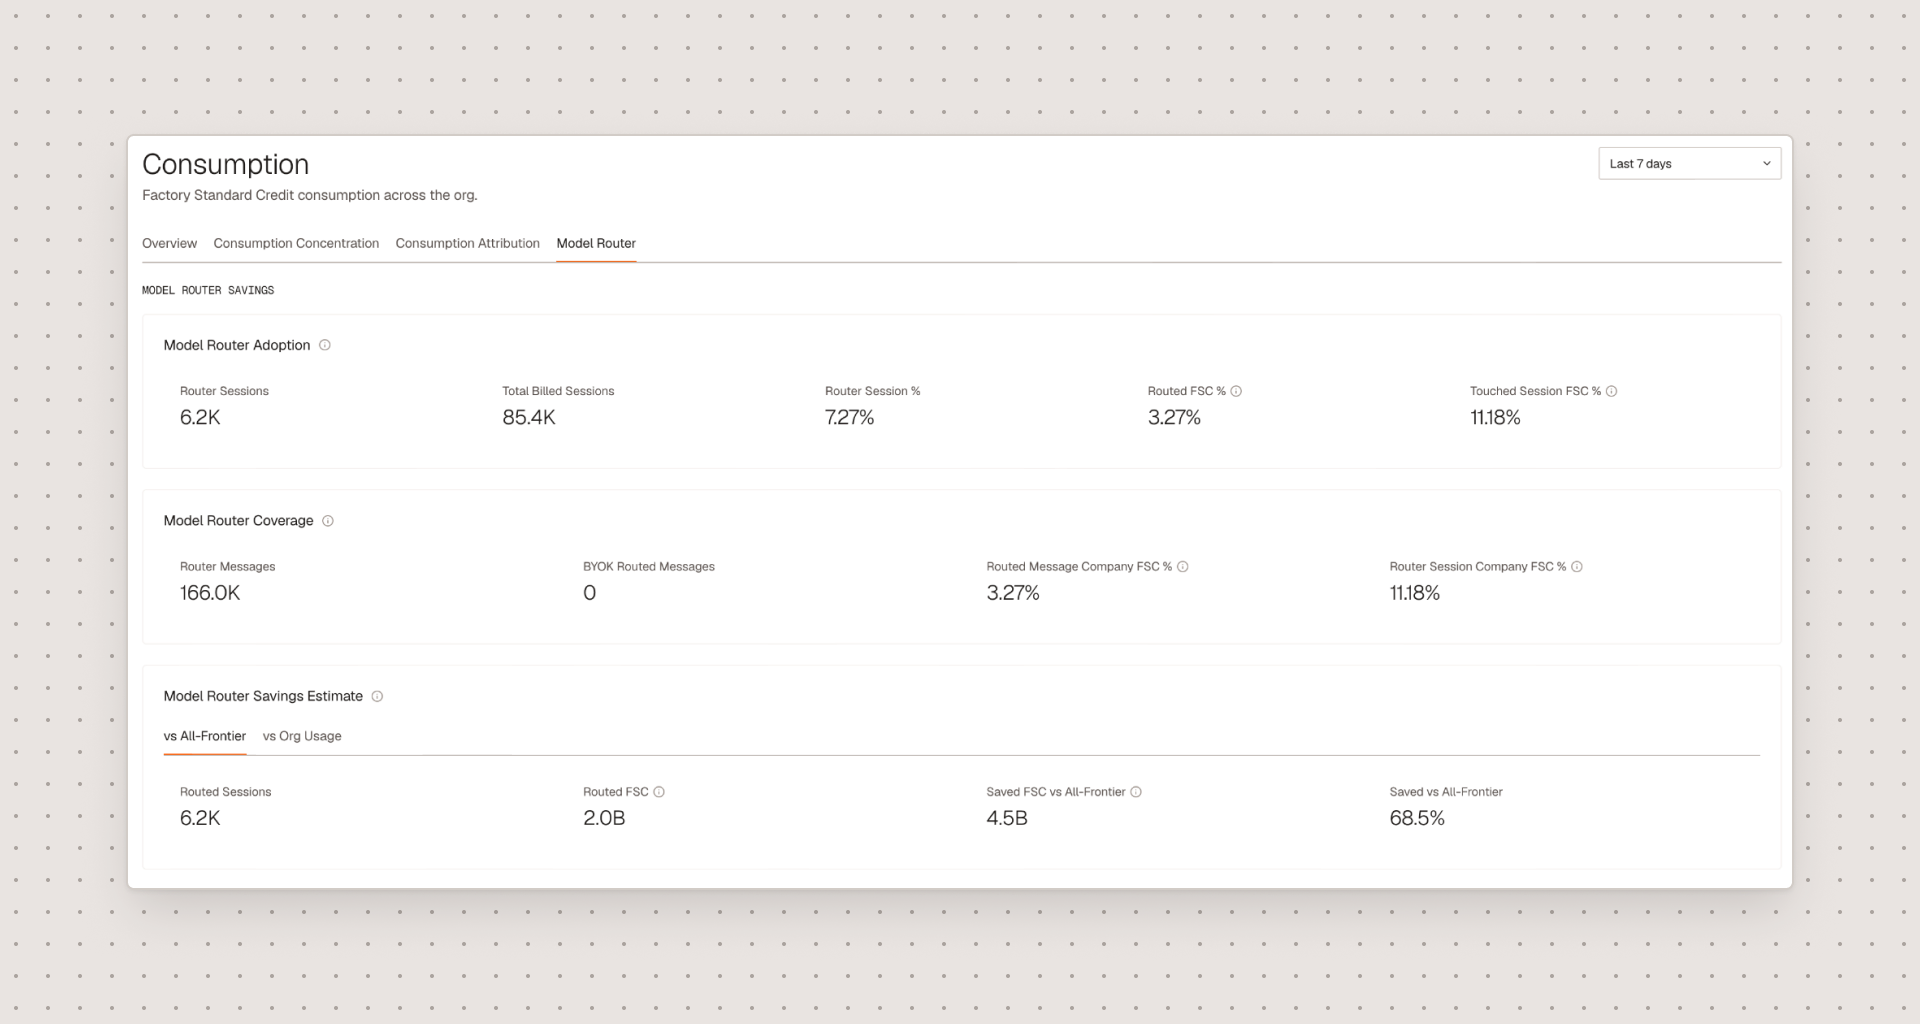
Controlling consumption should not require engineers to ration prompts or cut sessions short. Factory Router selects an efficient model for each request automatically, reducing aggregate cost by 63% in production compared with frontier-model rates, while holding frontier-level performance in Factory evaluations. Analytics reports the estimated savings for each organization, and Enterprise Controls let leaders set model defaults and policy centrally.
The Adoption view reports daily and monthly active users and sessions, showing how usage is penetrating your organization. Together with the Consumption view, leaders see both who uses Factory and what that usage consumes.
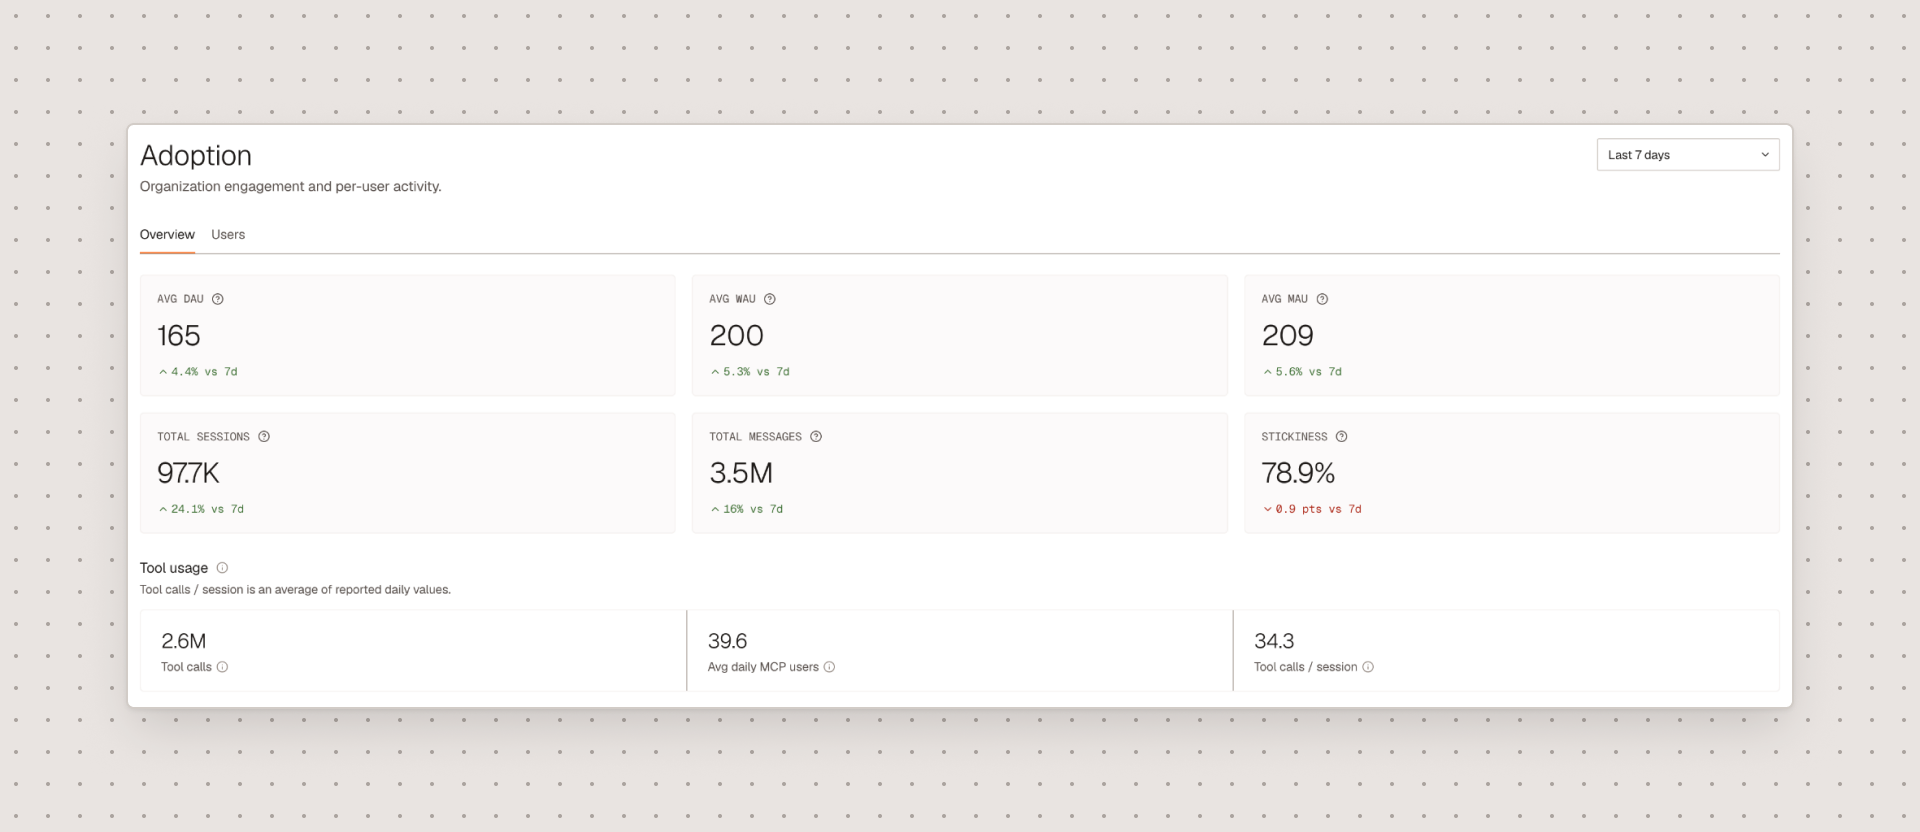
Engineering leaders can see who is driving usage and whether adoption is keeping pace, so enablement is directed where it is needed. Budget owners get the adoption data behind decisions to expand the rollout. Leaders can expand access without restricting how engineers work, because consumption stays visible by user and by model.
Every card includes a tooltip that defines the metric and explains how it is calculated. Enterprise organizations that report in their own BI tools can pull usage by model and user through the Analytics API.
Analytics is available today for organizations on Business and Enterprise plans. Owners and Managers can open Analytics from the profile menu in Factory.
Start building